3 Real Project Planning: The Business Understanding Canvas
In the previous chapter, you learned to identify stakeholders, map them onto the power vs. interest grid, and translate qualitative questions into analytical objectives. However, in a real-world project, that translation does not happen spontaneously inside your head: it is documented. A professional data team leaves a written audit trail of every business conversation and condenses that evidence into a single-page artifact that any team member—or any new stakeholder—can read in five minutes and understand exactly what will be done, why, and how success will be measured.
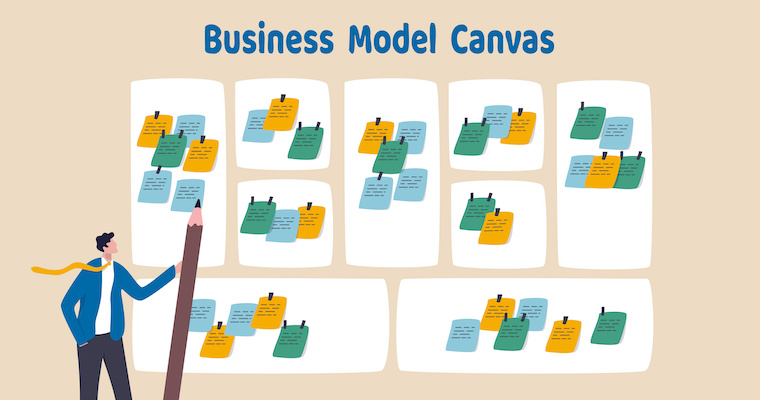
That artifact is the Business Understanding Canvas. It serves as the tangible output of the first phase of any structured data mining methodology (you will formalize this later as the Business Understanding phase of CRISP-DM (Chapman et al. 2000; Shearer 2000; Wirth and Hipp 2000)). Here, we will build it practically around a real case study so that when you reach the full methodological framework, you already have an intuitive grasp of the problem each component solves.
In this chapter, you will construct the five core pieces that comprise a project’s business understanding documentation:
- A meeting log with the stakeholder.
- The single-page Business Understanding Canvas.
- A set of 3 to 4 prioritized research questions.
- The business success criteria.
- A list of assumptions and risks (including at least two real risks and their mitigations).
We will do this by continuing the TheLook eCommerce case study introduced in the previous chapter, where the Marketing Director requested a drive to promote the new luxury accessories line among frequent buyers of designer dresses.
3.1 Step 1: The Stakeholder Meeting Log
Before synthesizing anything, the conversation is documented exactly as it occurred. A meeting log is not an embellished summary: it is an accurate record of who said what, what was agreed upon, and what remains pending. It serves as a single source of truth if scope disagreements arise later.
3.1.1 Essential Components of a Meeting Log
- Metadata: Date, time, duration, modality, and location.
- Participants: Name, role, and quadrant on the power/interest grid.
- Context: What triggered the meeting.
- Questions and Answers: The actual exchange during the discovery conversation.
- Decisions and Agreements: What was explicitly accepted by both parties.
- Action Items and Next Steps: With assigned owners and deadlines.
3.1.2 Applied Example: “Luxury Accessories” Project Kickoff
3.2 Step 2: The Business Understanding Canvas (Single Page)
The canvas condenses the meeting log into six blocks that anyone from business or technical teams can review in minutes. These six blocks correspond directly to tasks defined in the CRISP-DM guide (Chapman et al. 2000) for the Business Understanding phase—determining business objectives, assessing the situation, determining data mining goals, and producing a project plan—unfolded here into business and technical success criteria. Unlike the meeting log (which is chronological and detailed), the canvas is timeless and synthetic: it is the document archived and referenced throughout the project.
1. Business Objectives
Increase the gross margin of frequent designer dress buyers through cross-selling luxury accessories before the end-of-year campaign.
2. Business Success Criteria
+8% incremental margin in the pilot segment during the 6 weeks post-launch, measured against a control group.
3. Situation Assessment
Resources: Access to TheLook DW (tables orders, order_items, users, inventory_items); one data analyst; Inventory Manager as stock availability source.
Requirements: Actionable results within 6 weeks; recommendations adhering to regional stock availability.
Assumptions: Historical co-purchase behavior (dress + accessory) is representative of future customer behavior.
Risks: See risk table in the following section.
4. Data Mining Objectives
Discover association rules between designer dresses and accessories, and generate a recommendation ranking per customer, filtered by regional inventory availability.
5. Technical Success
Lift > 1.2 and confidence > 30% on association rules selected for the campaign.
6. Project Plan
Week 1: extraction and EDA of segment. Weeks 2-3: association rules and inventory validation. Week 4: review with Marketing Director. Weeks 5-6: controlled pilot and incremental margin measurement.
Note that Block 5 (Technical Success) uses a model metric (lift, confidence), whereas Block 2 (Business Success Criteria) uses a financial metric (incremental margin). This distinction is intentional and explored further in the next step.
3.3 Step 3: Prioritized Research Questions
Rarely is there a single analytical question behind a project. It is the analyst’s task to decompose the business objective into several research questions and prioritize them according to business impact and feasibility given available data—applying the same logic as the power/interest grid, now applied to questions rather than people.
| # | Research Question | Business Impact | Data Feasibility | Priority |
|---|---|---|---|---|
| 1 | Which accessories are purchased together with designer dresses most frequently? | High | High | 1 (Pilot) |
| 2 | Which accessories should be recommended when regional stock is limited without frustrating demand? | High | Medium | 2 |
| 3 | Does the cross-selling effect vary by region or order fulfillment warehouse? | Medium | High | 3 |
| 4 | Do customers receiving recommendations increase long-term purchase frequency (not just order value)? | High | Low (requires longitudinal data not yet available) | 4 (Out of pilot scope) |
Question 1 concentrates the effort of the pilot because it combines high impact with data already available in the Data Warehouse. Question 4, while valuable, requires a longer observation window and is documented for a second iteration rather than discarded.
3.4 Step 4: Success Criteria in Business Terms
A common mistake among junior analysts is defining success exclusively through model metrics (accuracy, recall, AUC, lift). Those metrics are necessary but are not the project success criteria: they are the model success criteria. Stakeholders cannot evaluate whether an AUC of 0.83 represents a good investment; they can evaluate whether gross margin increased. This distinction between business objectives and data mining goals is, according to Provost and Fawcett (2013), the most frequent source of analytical projects that produce technically correct but commercially irrelevant models.
| Criteria Type | Project Example | Evaluated By |
|---|---|---|
| Business (the one that matters to approve or cancel the project) | +8% incremental margin in pilot segment vs. control group over 6 weeks | Marketing Director |
| Technical (the one used by data team to iterate model) | Lift > 1.2 and confidence > 30% on association rules | Data Analyst |
3.5 Step 5: Assumptions and Risks
Every canvas simplifies project complexity. Therefore, it must be complemented with a list of assumptions and a risk log.
An assumption is a condition accepted as true even if unverified. A risk is an uncertain event that could impact project development or results. Assumptions must be validated; risks must be evaluated and mitigated.
3.5.1 Assumptions
For the pilot project, the following assumptions are established:
- Historical co-purchase behavior (e.g., dress + accessory) reasonably represents future customer behavior during the campaign.
- Inventory files will be updated weekly during the six weeks of the pilot.
- The frequent customer segment contains sufficient transaction volume to generate reliable association rules.
- The Marketing team can incorporate recommendations into their campaign schedule.
Key assumptions should be tested in early stages. If any prove false, adjustments to data, methods, or scope may be required.
3.5.2 Risk Classification
Classifying risks ensures ownership allocation and prevents narrowing analysis strictly to technical issues. In analytics projects, five main categories are recognized:
- Data: Quality, availability, recency, or representativeness issues.
- Analytical: Bias, seasonality, overfitting, spurious associations, or performance decay.
- Operational: Stock outages, insufficient operational capacity, or downstream processes unable to consume results.
- Technological & Security: Integration failures, excessive permissions, unauthorized access, or system outages.
- Legal, Ethical & Reputational: Misuse of personal data, algorithmic bias, or invasive personalization perception.
Adoption risks may also exist if end users do not understand, trust, or adopt the solution.
3.5.3 Risk Evaluation
Each risk must be evaluated based on its probability and impact. This scoring allows prioritizing risks requiring immediate attention.
Alongside mitigation plans, it is best practice to record:
- Assigned owner;
- Warning signal indicating risk occurrence;
- Preventive control;
- Contingency plan.
3.5.4 Project Risk Log
| # | Classification | Risk | Probability | Impact | Mitigation |
|---|---|---|---|---|---|
| 1 | Privacy | Extracting VIP customer information could expose personal data outside authorized teams, violating privacy regulations (Congreso de los Estados Unidos Mexicanos 2010). | Medium | High | Remove unnecessary identifiers, apply IAM/RBAC controls, and maintain access audit logs. |
| 2 | Operational | Model might recommend accessories without sufficient regional inventory. | High | Medium | Validate recommendations against inventory_items before campaign dispatch and set minimum safety stock thresholds. |
| 3 | Analytical | Associations might be driven by specific seasonal trends and fail to repeat during pilot. | Medium | Medium | Compare rules across multiple historical time windows prior to deployment. |
| 4 | Data | Inventory files could be incomplete or outdated. | High | High | Automate freshness checks and halt automated feeds if data fails validation checks. |
| 5 | Adoption | Marketing team might refrain from using recommendations if underlying logic is unclear. | Medium | Medium | Explain recommendation rationale, train users, and collect feedback during pilot runs. |
3.5.5 Risk Treatment and Follow-Up
After evaluating risks, the team can choose to:
- Avoid: Modify design to eliminate root cause.
- Mitigate: Reduce probability or impact.
- Transfer: Share management with a vendor or specialized department.
- Accept: Acknowledge risk and prepare contingency responses.
The risk log should be reviewed during the pilot and updated as data, models, or operational conditions evolve.
3.5.6 Risk Management Summary
3.6 Activity: Build Your Own Business Understanding Canvas
Using the blank framework structure below, select a business scenario (you can use one of the four TheLook eCommerce cases from the previous chapter, or one agreed upon with your instructor) and complete all five pieces from this chapter:
- Write a simulated meeting log of a 30-40 minute discovery session with a stakeholder, including at least three discovery questions and answers.
- Complete the six-block canvas.
- Prioritize between 3 and 4 research questions using an impact/feasibility table.
- State the business success criteria in a single sentence, alongside its technical counterpart.
- Document at least two real (non-generic) risks along with their mitigations.
This document will serve as the foundation upon which you build your data project throughout this course: every subsequent modeling decision in Parts III through V should be justified by tracing back to these five core elements.