Internal Stakeholders
Part of the organization and directly participate in its decisions, processes, or activities.
Owners
Shareholders
Executives
Employees
In most data mining and data warehousing courses, the starting point is usually a clean database or a supervised learning algorithm such as decision trees or logistic regression. However, in the real world, analytical projects do not begin with data ready to be processed. They begin with a business need, a vague question, or an operational problem expressed by people who do not necessarily understand algorithms or dimensional modeling.

The success of a data project is not measured by the accuracy of the model (for example, an AUC of 0.95), but by the economic or strategic impact it generates for the organization. Therefore, the initial phase of any successful data project, Business Understanding (the initial phase of the CRISP-DM methodology that we will study later in the course (Chapman et al. 2000)), is the most critical. Before writing the first line of code or importing modeling libraries, we must deeply understand what the organization seeks to solve. To execute this successfully, it is essential to master communication with stakeholders (interested parties) and translate their qualitative needs into structured quantitative technical problems.
In analytics and data mining projects, identifying stakeholders makes it possible to understand who will use the results, who might be affected, and who has the capacity to guide or decide the project’s direction. Following the identification and analysis techniques described by Bryson (2004), stakeholders can be studied using two complementary criteria: their relationship with the organization and their role within the project.
One way to classify stakeholders is based on their relationship with the organization responsible for the project.
Part of the organization and directly participate in its decisions, processes, or activities.
Not part of the organization, but may be affected by or influence its activities.
This second classification does not replace the previous one. The same stakeholder can be internal or external while simultaneously being primary, secondary, or key.
Directly receive the benefits or consequences of the project results.
Examples:Indirectly affected because the project modifies their processes, responsibilities, or environment.
Examples:Have authority, influence, specialized knowledge, or funding capacity over the project.
Examples: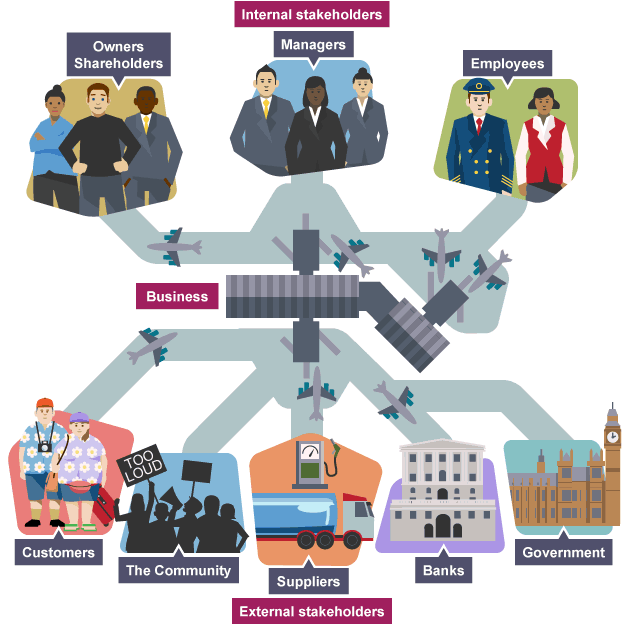
In the operations of an international airport, internal stakeholders can be identified, such as the airport authority, security personnel, and operational managers; and external stakeholders, such as passengers, airlines, suppliers, ground transportation companies, government agencies, and investors.
If an analytical system is developed to predict delays, passengers, pilots, and operators could be considered primary stakeholders; service providers and ground transportation companies, secondary stakeholders; and the airport authority, regulatory bodies, and project sponsors, key stakeholders.
The classification depends on the scope of the project and how each actor is affected or can influence decisions.
To manage expectations efficiently and prevent a lack of alignment from derailing a data project, the Power vs. Interest Grid (also known as the Influence/Interest Matrix) is used. Originally proposed by Mendelow (1981) and adopted as a standard stakeholder management practice by the PMBOK Guide (Project Management Institute 2017), this tool classifies stakeholders on a grid based on two key dimensions:
Below is the strategic alignment matrix diagram for data analytics projects:
High Power, Low Interest. Engage at key security, legal, and IT touchpoints to avoid late blockages.
High Power, High Interest. Sponsors and key business leaders. Strategic project partners.
Low Power, Low Interest. Minimal communication effort. Passive progress tracking.
Low Power, High Interest. Operational model users. Provide valuable feedback.
One of the most frequent errors in analytics projects is accepting a business question as originally phrased and immediately starting to work with the data. Expressions such as “we want to prevent customers from leaving” or “we need to increase sales” convey a legitimate concern, but they do not yet constitute an analytical objective.
The analyst’s role is not solely to extract data or build models. They must also act as a translator between business needs and the organization’s analytical capabilities. This involves transforming a general concern into a concrete, measurable question tied to a decision.
Scope definition—or scoping—is the process by which the following are clarified:
Only after establishing these elements does it make sense to evaluate what data is available and what methodology could be used.
This translation is the starting point for any analytical project. Once the business need is understood, the team can study the available data, prepare it, perform the analysis, evaluate whether the results answer the original question, and, when necessary, deploy a solution into production. Therefore, scope definition is not a formality prior to analysis: it is the stage that guides all subsequent decisions.
A qualitative question must pass through several layers of definition before becoming a technical objective. The goal is not to replace stakeholder language with statistical jargon, but to build a shared specification that connects analysis with concrete action.
In this example, the outcome of the process is not yet the selection of an algorithm. Deciding in advance that XGBoost, Random Forest, or any other technique will be used can restrict the analysis before understanding the problem. The methodology should be chosen after confirming the objective, reviewing the data, and establishing how the solution’s utility will be evaluated.
A stakeholder’s initial question rarely contains all the necessary context. Therefore, scope definition should be treated as an iterative conversation rather than a single-pass questionnaire.
A useful strategy is to move forward layer by layer. Each response allows for formulating a more precise question, detecting assumptions, and returning to the stakeholder to validate understanding. The cycle ends when both parties can clearly articulate what will be analyzed, what it will be used for, and how a useful outcome will be recognized.
Several inquiry strategies can be combined during this cycle:
Ask about context before asking about the solution.
Instead of starting with “what dashboard do you need?”, it is better to ask “what situation motivated this request?”. This avoids confusing delivery format with the problem to be solved.
Connect analysis with a decision.
Questions such as “what would you do differently if you had this information?” help determine if the analysis will have a concrete application. If no decision is attached, the request may still be too broad.
Turn ambiguous concepts into operational definitions.
Terms like active customer, churn, success, profitability, or underperformance can mean different things across departments. The analyst must ask how they are practically observed and calculated.
Define population, timeframe, and level of detail.
It is necessary to specify whether analysis will be conducted by customer, transaction, product, store branch, or region, as well as establishing the relevant historical window and future horizon.
Explore constraints and actionability.
Detecting a pattern is not enough if the organization cannot act upon it. Ask what interventions are available, their cost, and how many cases the team can handle.
Reformulate and validate.
After listening to responses, the analyst should summarize the shared understanding: “So, what we need is…”. This reformulation allows the stakeholder to correct misinterpretations before investing time in analysis.
Suppose a stakeholder presents the following need:
“We want to prevent customers from leaving.”
The conversation might progress as follows:
After this iteration, the original question might be reformulated as follows:
Analytical Objective: Identify weekly monthly-subscription customers with the highest probability of cancelling over the next 30 days, using their activity over the last 90 days, to prioritize up to 2,000 contacts for the retention team. The solution will be evaluated on its ability to identify actual cancellations and on revenue retained through intervention.
This formulation establishes a target population, observation window, prediction horizon, operational capacity, and metric of business value. From here, the team can evaluate data availability and compare candidate methodologies.
| Stakeholder Question | Analytical Translation | Possible Methodology |
|---|---|---|
| How can we increase average order value in the online store? | Identify products that tend to be purchased together and evaluate which combinations could be used in recommendation systems during checkout. | Association rules—Apriori or FP-Growth—evaluated via support, confidence, and lift. |
| How do we prevent customer churn in monthly subscriptions? | Estimate cancellation probability during the next 30 days based on recent activity, aiming to prioritize retention interventions. | Supervised classification models evaluated with metrics aligned with operational capacity and intervention costs. |
| We want personalized campaigns, but don’t know how to group customers. | Identify customer clusters displaying similar recency, frequency, monetary value, and purchasing patterns. | RFM segmentation and clustering techniques like K-Means or DBSCAN, paired with profile interpretation. |
| We need to know if end-of-year discounts worked. | Estimate the net margin effect of discounts and isolate it from seasonal shifts or concurrent factors. | Causal inference or quasi-experimental analysis, depending on control group availability and historical data. |
These methodologies are starting points, not automated decisions. The final choice depends on data quality, underlying assumptions, and how the results will be operationalized.
Once the objective is validated, the agreement should be recorded. The Data Request is the formal mechanism through which business units communicate a need to the analytics team and document context, scope, and success criteria.
Definition — Data Request: A formal process, typically represented via an intake form or ticket, that captures business needs and key details to evaluate, prioritize, and execute an analytical project.
The request ticket does not replace conversation with the stakeholder. Its function is to preserve agreements reached during refinement and minimize subsequent ambiguity.
Main Problem or Question
What situation needs to be understood, solved, or improved?
Business Context
Why did this need arise, and why is it relevant now?
Expected Action or Decision
What will be done differently based on the result?
Population and Scope
Which customers, products, transactions, regions, or time periods are included?
Success Metrics
How will the business determine if the analysis was useful?
Known or Suggested Data Sources
Are there existing tables, files, systems, or third-party providers with relevant data?
Delivery Format
Is an exploratory analysis, report, dashboard, prioritized list, experiment, or embedded model required?
Validation Lead
Who will sign off on definitions, results, and downstream decisions?
Constraints and Risks
Are there timelines, privacy concerns, budget limits, operational capacities, or data quality risks?
Target Decision Date
By when must the results be delivered to remain actionable?
The quality of an analytical project depends heavily on the quality of the originating question. An ambiguous goal can produce technically sound but useless analysis; a well-defined goal enables coherent selection of data, metrics, and methods.
Defining scope means building a shared understanding between the stakeholder and data team. To achieve this, analysts must ask, listen, reformulate, and validate iteratively. The result is not merely a technical question, but an explicit bridge between data, decisions, and business value.
Imagine you are hired as the Lead Data Analyst at TheLook eCommerce (the recurring case study used throughout this course). The Marketing Director approaches you with the following request:
“I need a report with all customers and everything they buy because women’s clothing sales fell this month and we want to launch a discount.”
If you act reactively, you will write a heavy SQL query, export a multi-gigabyte CSV with millions of rows, and email it. This is a direct path to project failure: the stakeholder will fail to open the file due to size limits, or spend hours filtering Excel without extracting clear conclusions.
Outcome: You saved technical effort from extracting entire databases, delivered a high-impact analysis targeting high-margin conversions, and aligned business expectations from day one.